QUESTION 23
Instructions
Exam Environment
Exam Interface and Controls
The exam panel provides access to the project task(s). Each project has an associated file in which you will perform the project tasks.
Overview:
Car Warranty
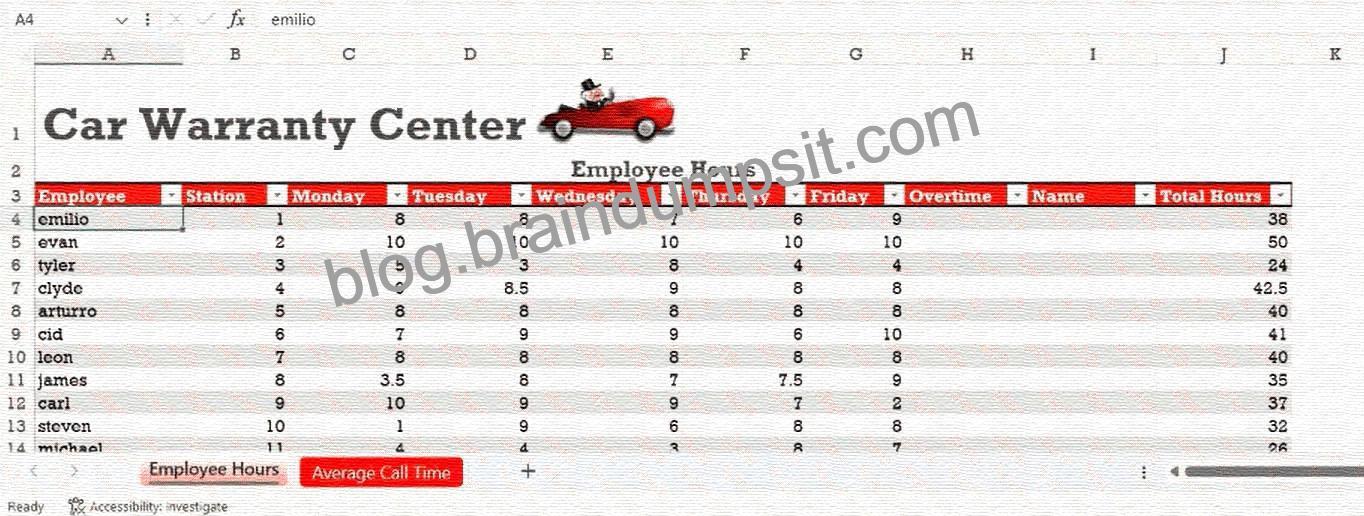
You are the supervisor for a Car Warranty Center. You use Excel to report employee hours and telephone calls.
Task5:
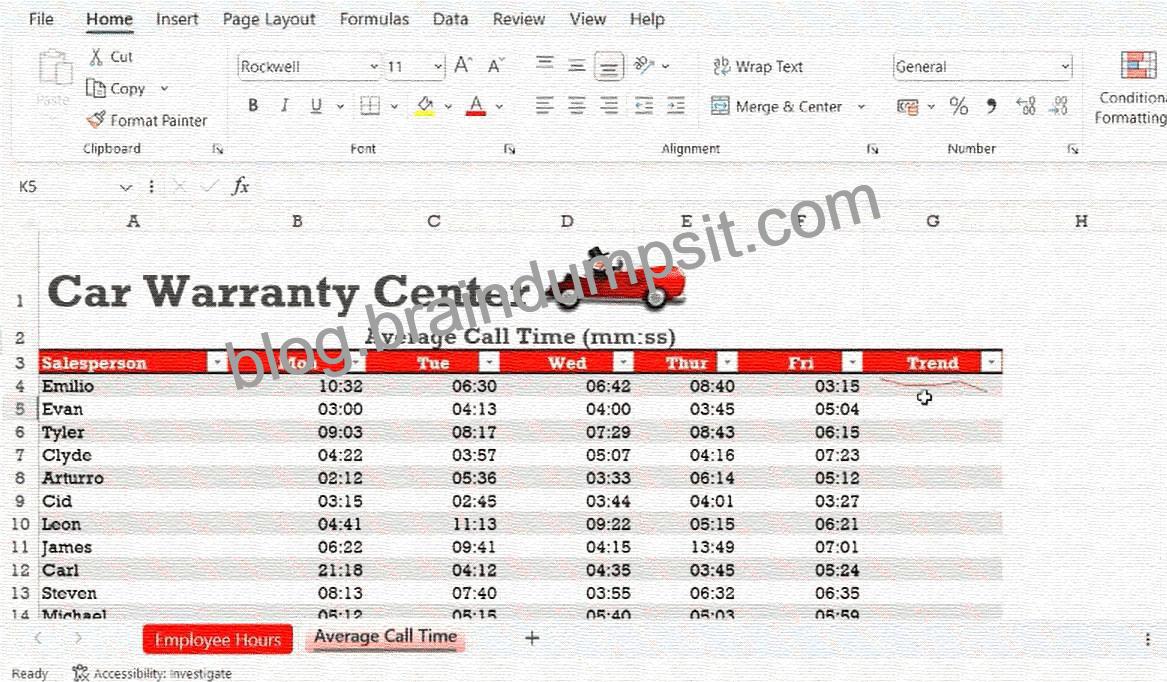
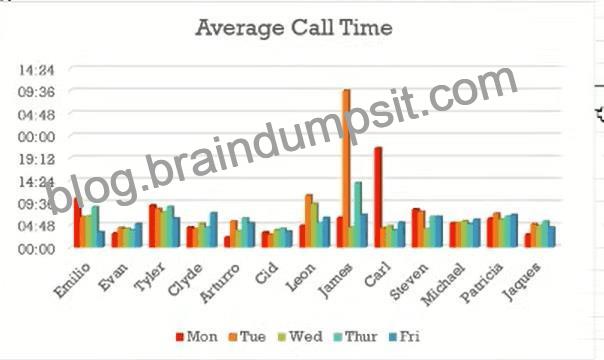
On the Average Call Time worksheet, create a 3-D Clustered Column chart that shows the call times for each Salesperson from Mon through Fri. Insertthe Chart Title Average Call Time. Position the new chart below the table.
See the solution in Explanation below.
Explanation:
To completeTask 5, you will create a 3-D Clustered Column chart on theAverage Call Timeworksheet to visualize the weekly performance of each salesperson.
Step 1: Navigate to the Worksheet
Click on theAverage Call Timetab at the bottom of your Excel window to switch views.
Step 2: Select the Data Range
You need to select the names and the call times for all five days (Monday through Friday), butexcludethe
“Trend” column:
* Click and drag to select cellsA3 to F14.
* Note:This includes the header row (Salesperson, Mon, Tue, etc.) and all employee rows down to Michael.
Step 3: Insert the 3-D Clustered Column Chart
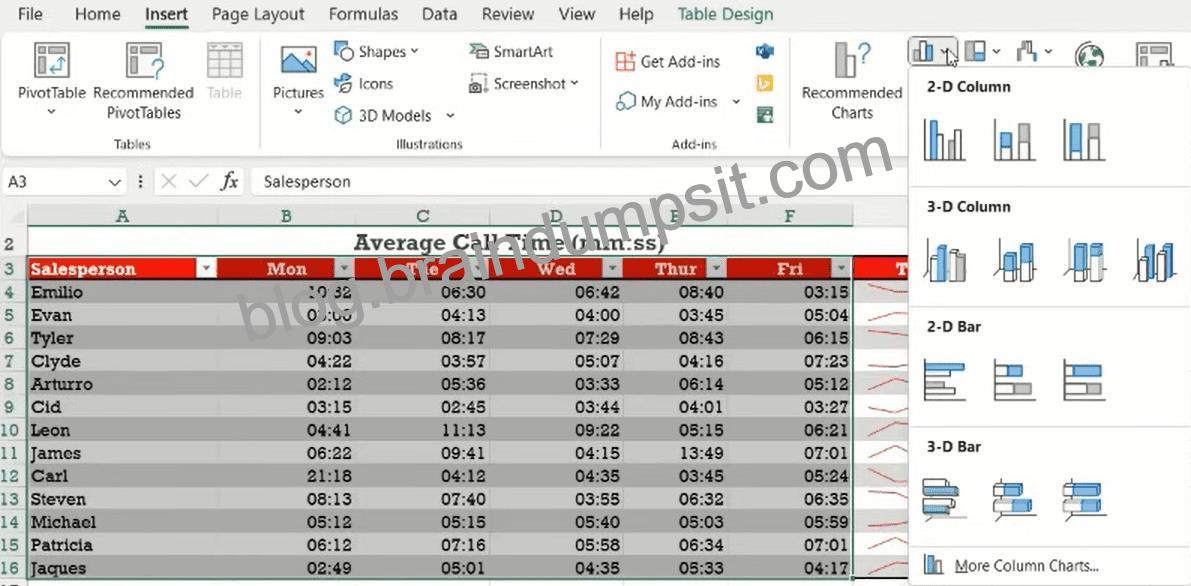
* Go to theInserttab on the Ribbon.
* In theChartsgroup, click theInsert Column or Bar Charticon (it looks like small vertical bars).
* Under the3-D Columnsection, select the first option:3-D Clustered Column.
Step 4: Add the Chart Title
* Click once on the default text that says “Chart Title” at the top of the new chart.
* TypeAverage Call Timeand pressEnter(or click outside the text box).
Step 5: Position the Chart
* Hover your mouse over a blank area of the chart (the chart area).
* Click and drag the chart so it is positionedbelow the table.
* Placement Tip:Usually, starting the chart around row 17 or 18 is ideal so it doesn’t overlap your data.


